Detecting Pedestrians on Streets of European Cities
06 Mar 2025Introduction
Pedestrian detection is a vital task in computer vision that directly impacts road safety. In busy European cities, where traffic is dense and complex, pedestrians are among the most vulnerable road users. Unlike cyclists or motorcyclists, pedestrians move unpredictably and often appear in unexpected places. This makes their detection a unique and critical challenge, distinct from simply identifying “people” in images.
While many modern vehicles use advanced sensors like LiDAR and radar, these are expensive and hardware-specific. In contrast, camera-based detection offers a low-cost, scalable solution. With only visual input, computer vision models can help identify pedestrians and alert drivers when unexpected behavior occurs — such as sudden crossings.
Given European cities’ complex pedestrian detection task, we explore three key aspects: robustness, transfer learning, and explainability. For that, we choose to experiment with two state-of-the-art models from the ultralytics library: YOLOv8 (Jocher et al., 2023) and RT-DETR (Zhang et al., 2023). This way, we build upon typical approaches, like bounding box detection algorithms, which use CNN and attention-based models.
1. Robustness
We evaluate how pedestrian detection models perform under varying lighting and weather conditions and suggest ways to improve their reliability.
2. Transfer Learning
We evaluate whether knowledge from models trained for pedestrian detection can be effectively transferred to a related task in the traffic domain: detecting traffic signs.
3. Explainability
To reduce the “black-box” nature of these models, we visualize their internal decision-making processes and examine how they respond to crowding and occlusion.
Research Questions
To create a better view of the problems that we want to solve, we propose the following research questions:
- How do weather and lighting affect model robustness?
- Can knowledge from pedestrian detection transfer to detecting road signs?
- What image regions do the selected models rely on across different crowding and occlusion levels?
This blog starts with related work and a description of our dataset and models. We then outline the training setup, present our experiments and results, discuss the results, and conclude the research.
Literature Review
Over the past years, different deep learning-based object detection architectures have emerged, among which the You Only Look Once (YOLO) (Redmon et al. (2016)) family and the Detection Transformer (DETR) (Carion et al. (2020)) models stand out for their real-time capabilities and performance.
Evolution of YOLO in Pedestrian Detection
The YOLO series has seen widespread adoption in object detection due to its high speed and accuracy. Introduced by Redmon et al. (2016), YOLO transformed object detection by treating it as a single regression problem. YOLOv5, for example, offered a lightweight structure suitable for real-time applications.
A more recent model variation, YOLOv8, has demonstrated enhanced performance through architectural improvements and refined training techniques. It has been applied in real-time scenarios, such as vehicle and pedestrian analysis under dynamic lighting and environmental conditions (Sadik et al., 2024). YOLOv8 is suitable for urban contexts where detection speed and precision are critical.
Evolution of DETR in Pedestrian Detection
The DETR model, introduced by Carion et al. (2020), brought transformer-based architectures to object detection, enabling end-to-end detection without the need for hand-designed components like anchor boxes or NMS (non-max suppression). Building on this foundation, RT-DETR (Real-Time DETR) (Zhang et al., 2023) aims to retain DETR’s benefits while reducing latency for real-time use.
A prominent RT-DETR-based model, FedsNet, was developed specifically for pedestrian detection. Compared to earlier transformer-based approaches, it achieved improved detection accuracy and reduced computational complexity (Peng & Chen, 2024). These characteristics make RT-DETR a compelling choice for fast and efficient pedestrian detection in smart traffic environments.
Rationale for Selecting YOLOv8 and RT-DETR
YOLOv8 and RT-DETR were selected for their high accuracy, real-time performance, and adaptability to diverse conditions. Prior research has shown both models to perform well under varied lighting and weather scenarios (Alimov & Meiramkhanov, 2024), making them well-suited for urban pedestrian detection tasks.
Our research builds upon proven, cutting-edge detection architectures to analyze robustness, transferability, and explainability in pedestrian detection tasks through this selection.
Dataset
We selected the EuroCity Persons (ECP) dataset for our experiments. ECP features street-level city images from a driver’s point of view in European cities. Given the large scale of the dataset, we decided to focus only on the validation part for our experiments: 10 GB and 4266 image-label pairs. We randomly split the images and corresponding annotations from all the cities into the train, validation, and test sets in a 70-10-20 ratio.
Model Training
Ulitralytics PyPI package offers both YOLOv8 and RT-DETR models pre-trained on COCO 2017 dataset for object detection (Lin et al., 2015). Although the dataset contains a label for people, it also contains 79 other diverse labels. We narrow down the capabilities of the models by fine-tuning them on a subset from the ECP validation dataset. To compare the models in fair conditions, we used the large models (YOLOv8l, RT-DETR-L) and gave each model 2.5 hours of fine-tuning time with a Tesla P100 GPU. So, both models were fine-tuned under time-consistent training conditions: YOLOv8 for 50 epochs and RT-DETR for 35 epochs.
The images were resized to fit a 640x640 pixels square with a preserved aspect ratio to speed up the training. The rest of the image was dynamically padded with grey pixels to fill the square. The rest of the parameters were set to default. A default data augmentation was applied, with the most notable being HSV color adjustments, mosaic composition, image erasing, and cropping.
Performence Evaluation
We compare the predictive performance of YOLOv8l and RT-DETR-L using standard evaluation metrics(precision, recall, F1-score, and mean average precision (mAP) at different intersection over union (IoU) thresholds). We use this combination of metrics to capture different aspects of model performance: precision and recall for detection quality, F1-score for balance between them, and mAP across IoU thresholds for overall localization accuracy. The results are presented in Table 1.
Table 1 : A comparison of YOLOv8l and RT-DETR-L models performance.
| Metric | YOLOv8 | RT-DETR |
|---|---|---|
| mAP at 0.05-0.95 IoU | 0.4546 | 0.4551 |
| mAP at 0.50 IoU | 0.7273 | 0.7628 |
| mAP at 0.75 IoU | 0.4776 | 0.4679 |
| Precision | 0.8129 | 0.8033 |
| Recall | 0.6514 | 0.6706 |
| F1-score | 0.7233 | 0.7310 |
The mean average precision (mAP) across IoU thresholds (0.05–0.95) is similar for both models, with RT-DETR slightly ahead. At 0.50 IoU, RT-DETR performs better (0.7628 vs. 0.7273), while YOLOv8 leads at 0.75 IoU (0.4776 vs. 0.4679), suggesting better localization accuracy.
YOLOv8 also has higher precision (0.8129 vs. 0.8033), producing fewer false positives, whereas RT-DETR achieves better recall (0.6706 vs. 0.6514), indicating stronger overall detection. Their F1 scores are close, with RT-DETR holding a slight edge.
So, RT-DETR excels at broad pedestrian detection, especially in crowded scenes, while YOLOv8 is more precise, making it preferable when accurate localization is critical. Given that the models have comparable performance, we propose the experiments from the next section to better understand and compare their capabilities in three different domains: robustness, transfer learning, and explainability.
Experiments
In this section we propose a series of experiments, which will test the YOLOv8 and RT-DETR models in three different domains: robustness, transfer learning, and explainability.
Augmentation Methods for testing robustness
Real-world conditions rarely match the training data. Augmenting images to simulate fog, rain, overexposure, and night-time conditions helps:
- Identify scenarios where models struggle.
- Improve model performance in varied environments.
- Critical for applications like autonomous driving and surveillance, thus increasing safety.
We have applied all the mentioned augmentations and applied them to 100 images from the testing set - thus generating 5 testset subsets with different augmentations to evaluate and compare the robustness of the fine-tuned models. The example augmentation can be seen in Figure 1.
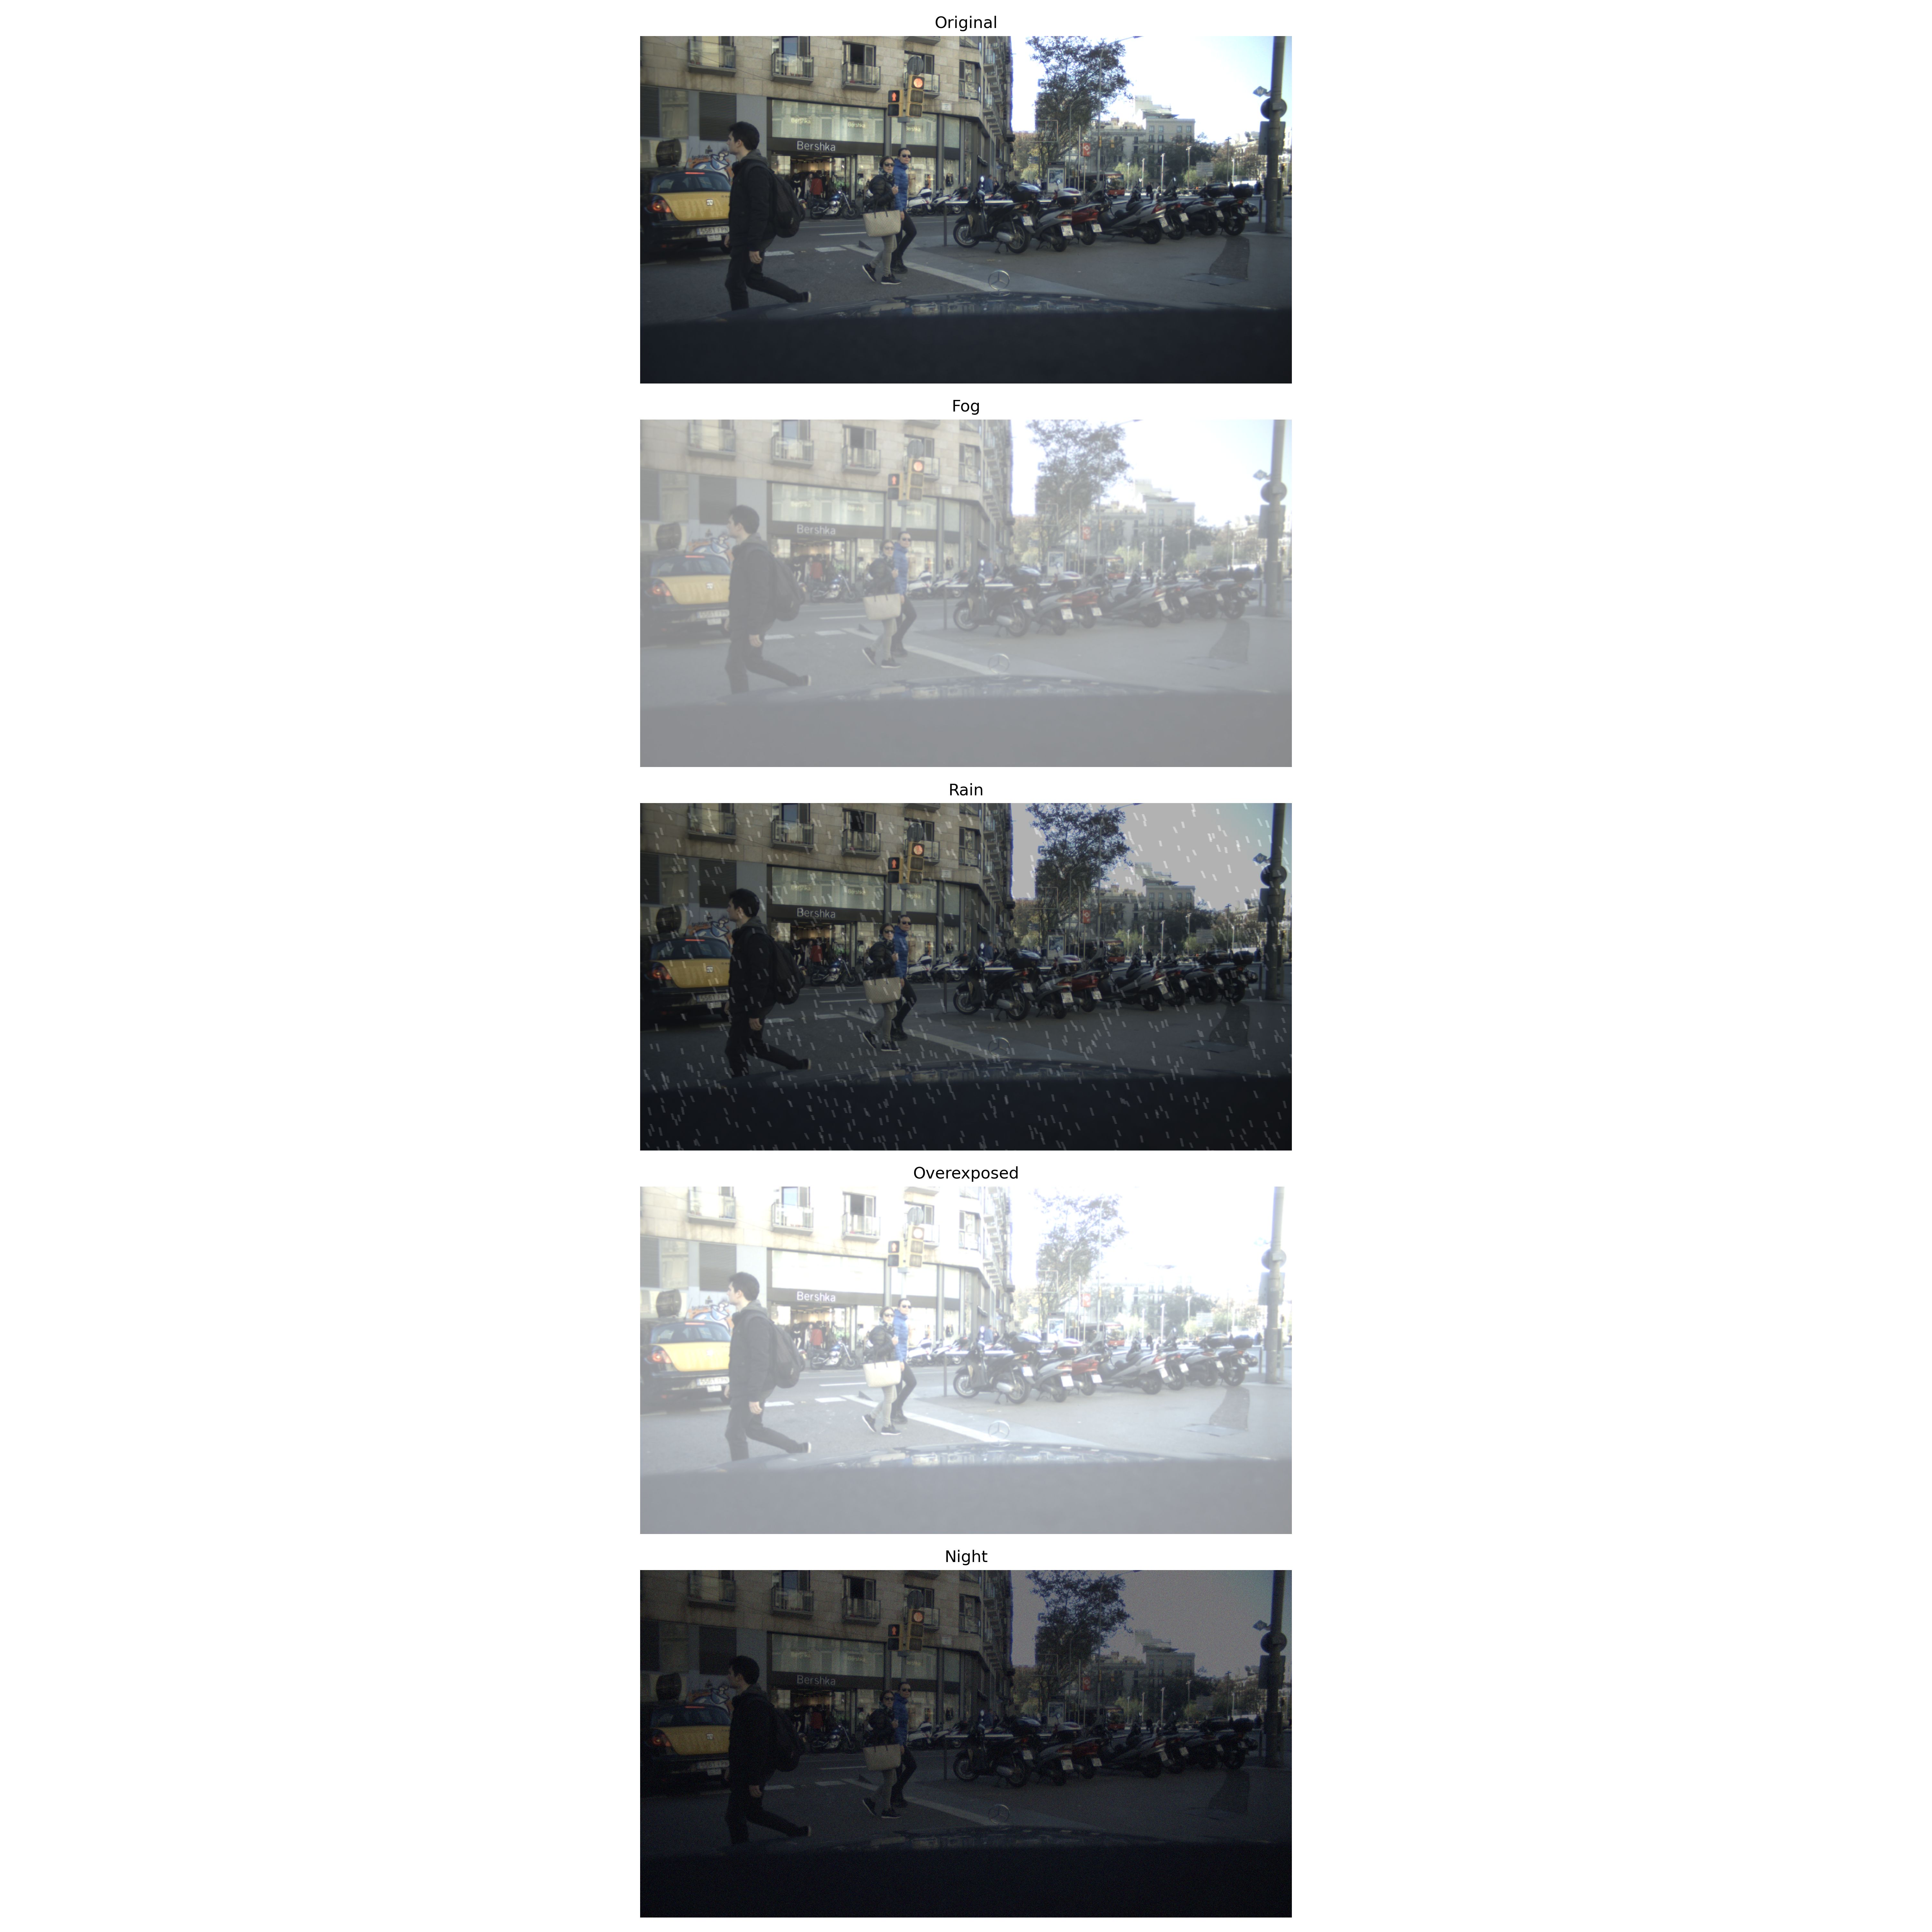
Figure 1 : Example augmentations applied to images to simulate fog, rain, overexposure, and night-time conditions.
The implementation of the augmentations was inspired by Kou, E., & Curran, N. (2024). Enhancing autonomous vehicle perception in adverse weather through image augmentation during semantic segmentation training. Retrieved from https://github.com/BubblyBingBong/AugmentationSegmentation. The details of the implementation are described below:
1. Fog Simulation
Fog reduces scene contrast and detail. Testing with foggy images can evaluate if the models can detect pedestrians even under low-visibility conditions.
The fog augmentation was implemented in the following way:
- White Overlay: Create a white image where every pixel is set to 255:
- Linear Blending: Blend the original image with the white layer:
- Gaussian Blur: \(I*{\text{blur}}(x,y) = \sum*{u,v} I(x-u, y-v) \, G(u,v)\)
where $ G(u,v) $ is the Gaussian kernel.
2. Rain Simulation
Rain introduces dynamic noise and streaks that can occlude parts of pedestrians. Testing with rainy images improves robustness against weather-induced artifacts.
The rain augmentation was implemented in the following way:
-
Rain Streaks Generation:
- Create a black layer.
-
For several streaks proportional to
rain_intensity:- Randomly select a starting point $(x, y)$.
- Choose a random length (15–25 pixels).
- Find end coordinates
\(\text{end_x} = x + \text{length} \times \sin(\theta), \quad\) \(\text{end_y} = y + \text{length} \times \cos(\theta)\)
with $\theta$ between 0.2 and 0.5 radians.
- Draw a white line representing a rain streak (thickness 2 pixels).
- Motion Blur: Convolve the rain layer with a 7×7 motion blur kernel:
This spreads the intensity horizontally, simulating falling rain. By experimenting, we discovered that this looks more realistic.
- Blending: Blend the rain layer with the original image:
3. Overexposure Simulation
Overexposure saturates image details. Testing with overexposed images ensures models can detect features even when details are lost.
The overexposure augmentation was implemented in the following way:
- White Blending: Blend the image with a white image:
This brightens the image and washes out details.
- Gaussian Blur: Apply a smaller Gaussian blur (5×5) to simulate loss of detail because.
4. Night Simulation
Night scenes have very low brightness, and the colors are slightly different. Testing with night-simulated images can evaluate if the low lighting conditions are also acceptable for the model to perform well.
The night augmentation was implemented in the following way:
- Brightness Reduction: Convert the image to HSV and reduce the brightness (value channel) by:
- Blue Tint: Blend the darkened image with a blue mask:
- Gaussian Noise: Add noise sampled from a normal distribution $ \mathcal{N}(0,10) $ and clip:
Transfer Learning on Traffic Sign Detection Dataset
To assess generalization, we applied transfer learning from pedestrian to traffic sign detection, a related task within the same visual domain. Both are key to autonomous driving and share challenges like cluttered scenes, small objects, and real-time constraints. The shared road context may further support model transferability.
We used the publicly available Traffic Sign Detection dataset for this experiment.
Traffic Sign Detection Dataset
This dataset contains 4,969 traffic sign images, divided into:
- Train Set: 3,530 images (71%)
- Validation Set: 801 images (16%)
- Test Set: 638 images (13%)
Preprocessing: Images are resized to 416x416 Augmentations: None applied
Classes: 15 total, including:
Green Light, Red Light, Speed Limit 10, Speed Limit 20, Speed Limit 30, Speed Limit 40, Speed Limit 50, Speed Limit 60, Speed Limit 70, Speed Limit 80, Speed Limit 90, Speed Limit 100, Speed Limit 110, Speed Limit 120, Stop
Full Fine-Tuning vs. Partial Fine-Tuning on Traffic Sign Detection Dataset
To explore the efficiency and effectiveness of transfer learning, we compared three fine-tuning strategies for the traffic sign detection task:
- Full Fine-Tuning: During training, all layers of the pre-trained model (on the pedestrian dataset) are updated.
- Partial Fine-Tuning: Only the final layers of the pre-trained model (on the pedestrian dataset) are updated, while the backbone layers remain frozen.
- Default (Ultralytics Weights): Models are fine-tuned directly using the default COCO-pretrained weights provided by the Ultralytics framework without any manual layer freezing.
Including the default-weight models is important, as it allows us to assess whether the general-purpose features learned from COCO are already sufficient for strong performance in a related domain and whether the training in the same setting can be an advantage. Moreover, comparing models with frozen and unfrozen backbones helps us evaluate the trade-off between training cost and performance.
As in the pedestrian detection task, we fine-tuned both models under consistent training conditions:
- YOLOv8 was trained for 50 epochs
- RT-DETR was trained for 35 epochs
Explainability with LIME and EigenCAM
To analyze how our models detect pedestrians in complex scenes, we applied two complementary explainability methods: LIME and EigenCAM.
LIME generates local explanations by perturbing the image and identifying which superpixels contribute most to each detection. EigenCAM, in contrast, visualizes class-agnostic activation maps based on internal feature layers, highlighting the regions of the strongest model’s attention.
We selected 100 random test images and manually selected images with varying levels of crowdedness and occlusion. For selected examples, we visualized both LIME and EigenCAM outputs for YOLOv8 and RT-DETR. For LIME, we increased num_samples to 2000 to improve the quality of the explanations. For EigenCAM, we used the default parameters. We selected Spatial Pyramid Feature Fusion (SPFF) as the layer of interest for visualizing YOLOv8 focus regions and input projection layers for RT-DETR. These layers are positioned after the backbone and before the final detection head, making them suitable for capturing the model’s most essential features from different scales. Bounding boxes of confidence less than 0.2 were not visualized.
Results and Discussion
Augmentation Methods for testing robustness
The results show that the robustness of RT-DETR and YOLO is environmentally conditioned. (See Figure 2) Under normal, well-lit conditions, RT-DETR outperforms YOLO on nearly all metrics, including mAP, precision, and recall, suggesting better detection accuracy under good visibility conditions. Under foggy weather, although both models have comparable mAP@0.50 scores, YOLO has a slight advantage over RT-DETR on stricter metrics (mAP@0.50–0.95, mAP@0.75, precision, and recall), which can possibly be explained by the fact that YOLO’s feature extraction is more capable of dealing with low-contrast images. Under rainy conditions, RT-DETR performs better with much higher mAP values and better precision and recall, showing a good ability to deal with image distortions and occlusions (like rain strokes). Overexposure shows little variation between models. YOLO is more robust in night or low-light settings and outperforms RT-DETR in every metric. While RT-DETR is more robust in the rain and well-lit scenes and performs better, YOLO is more stable under hard weather conditions such as fog, especially in low-light or night-time conditions.
It is important to note that fine-tuning the models using the described augmentation methods would potentially enhance their performance in various conditions, thus making them more robust. We recommend this as a direction for future research.
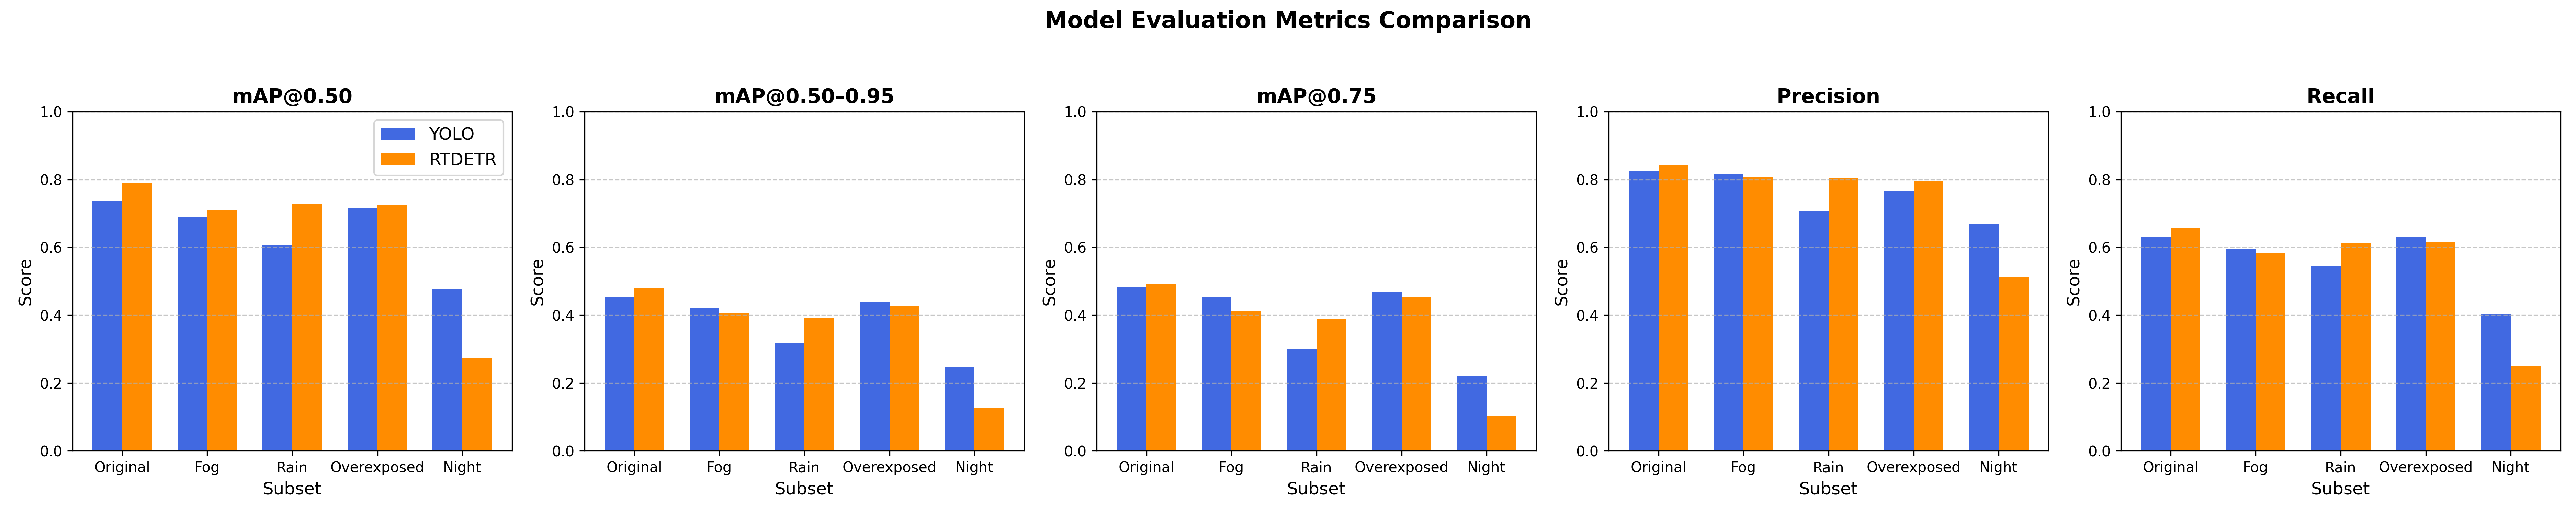 Figure 2 : Robustness comparison between RT-DETR and YOLO under various environmental conditions, including fog, rain, overexposure, and night-time scenarios.
Transfer Learning on Traffic Sign Detection Dataset
We evaluated how well RT-DETR and YOLO adapt to Traffic Sign Detection using full and partial fine-tuning. We also fine-tuned models with default COCO weights to see if general pretraining enables faster adaptation than task-specific pretraining.
Training Metrics Over Epochs
The Figure 3 illustrates how the models perform over the course of training epochs. RT-DETR initialized with the default Ultralytics weights achieves the best performance early on and consistently outperforms all other configurations across every metric. It reaches peak values quickly and maintains this lead throughout training. RT-DETR Full Fine-Tune also performs very well, eventually converging to performance levels close to the default version, though it starts more gradually. Interestingly, the RT-DETR Partial Fine-Tune variant achieves solid early gains but plateaus sooner, ultimately falling behind both the full and default versions. For YOLO, the Full Fine-Tune model demonstrates the most substantial improvement over epochs, steadily increasing across all metrics and surpassing both the Default and Partial Fine-Tune versions. YOLO Full and YOLO Partial Fine-Tune exhibit similar growth patterns early on, with YOLO Full Fine-Tune slightly outperforming YOLO Partial Fine-Tune across all metrics.
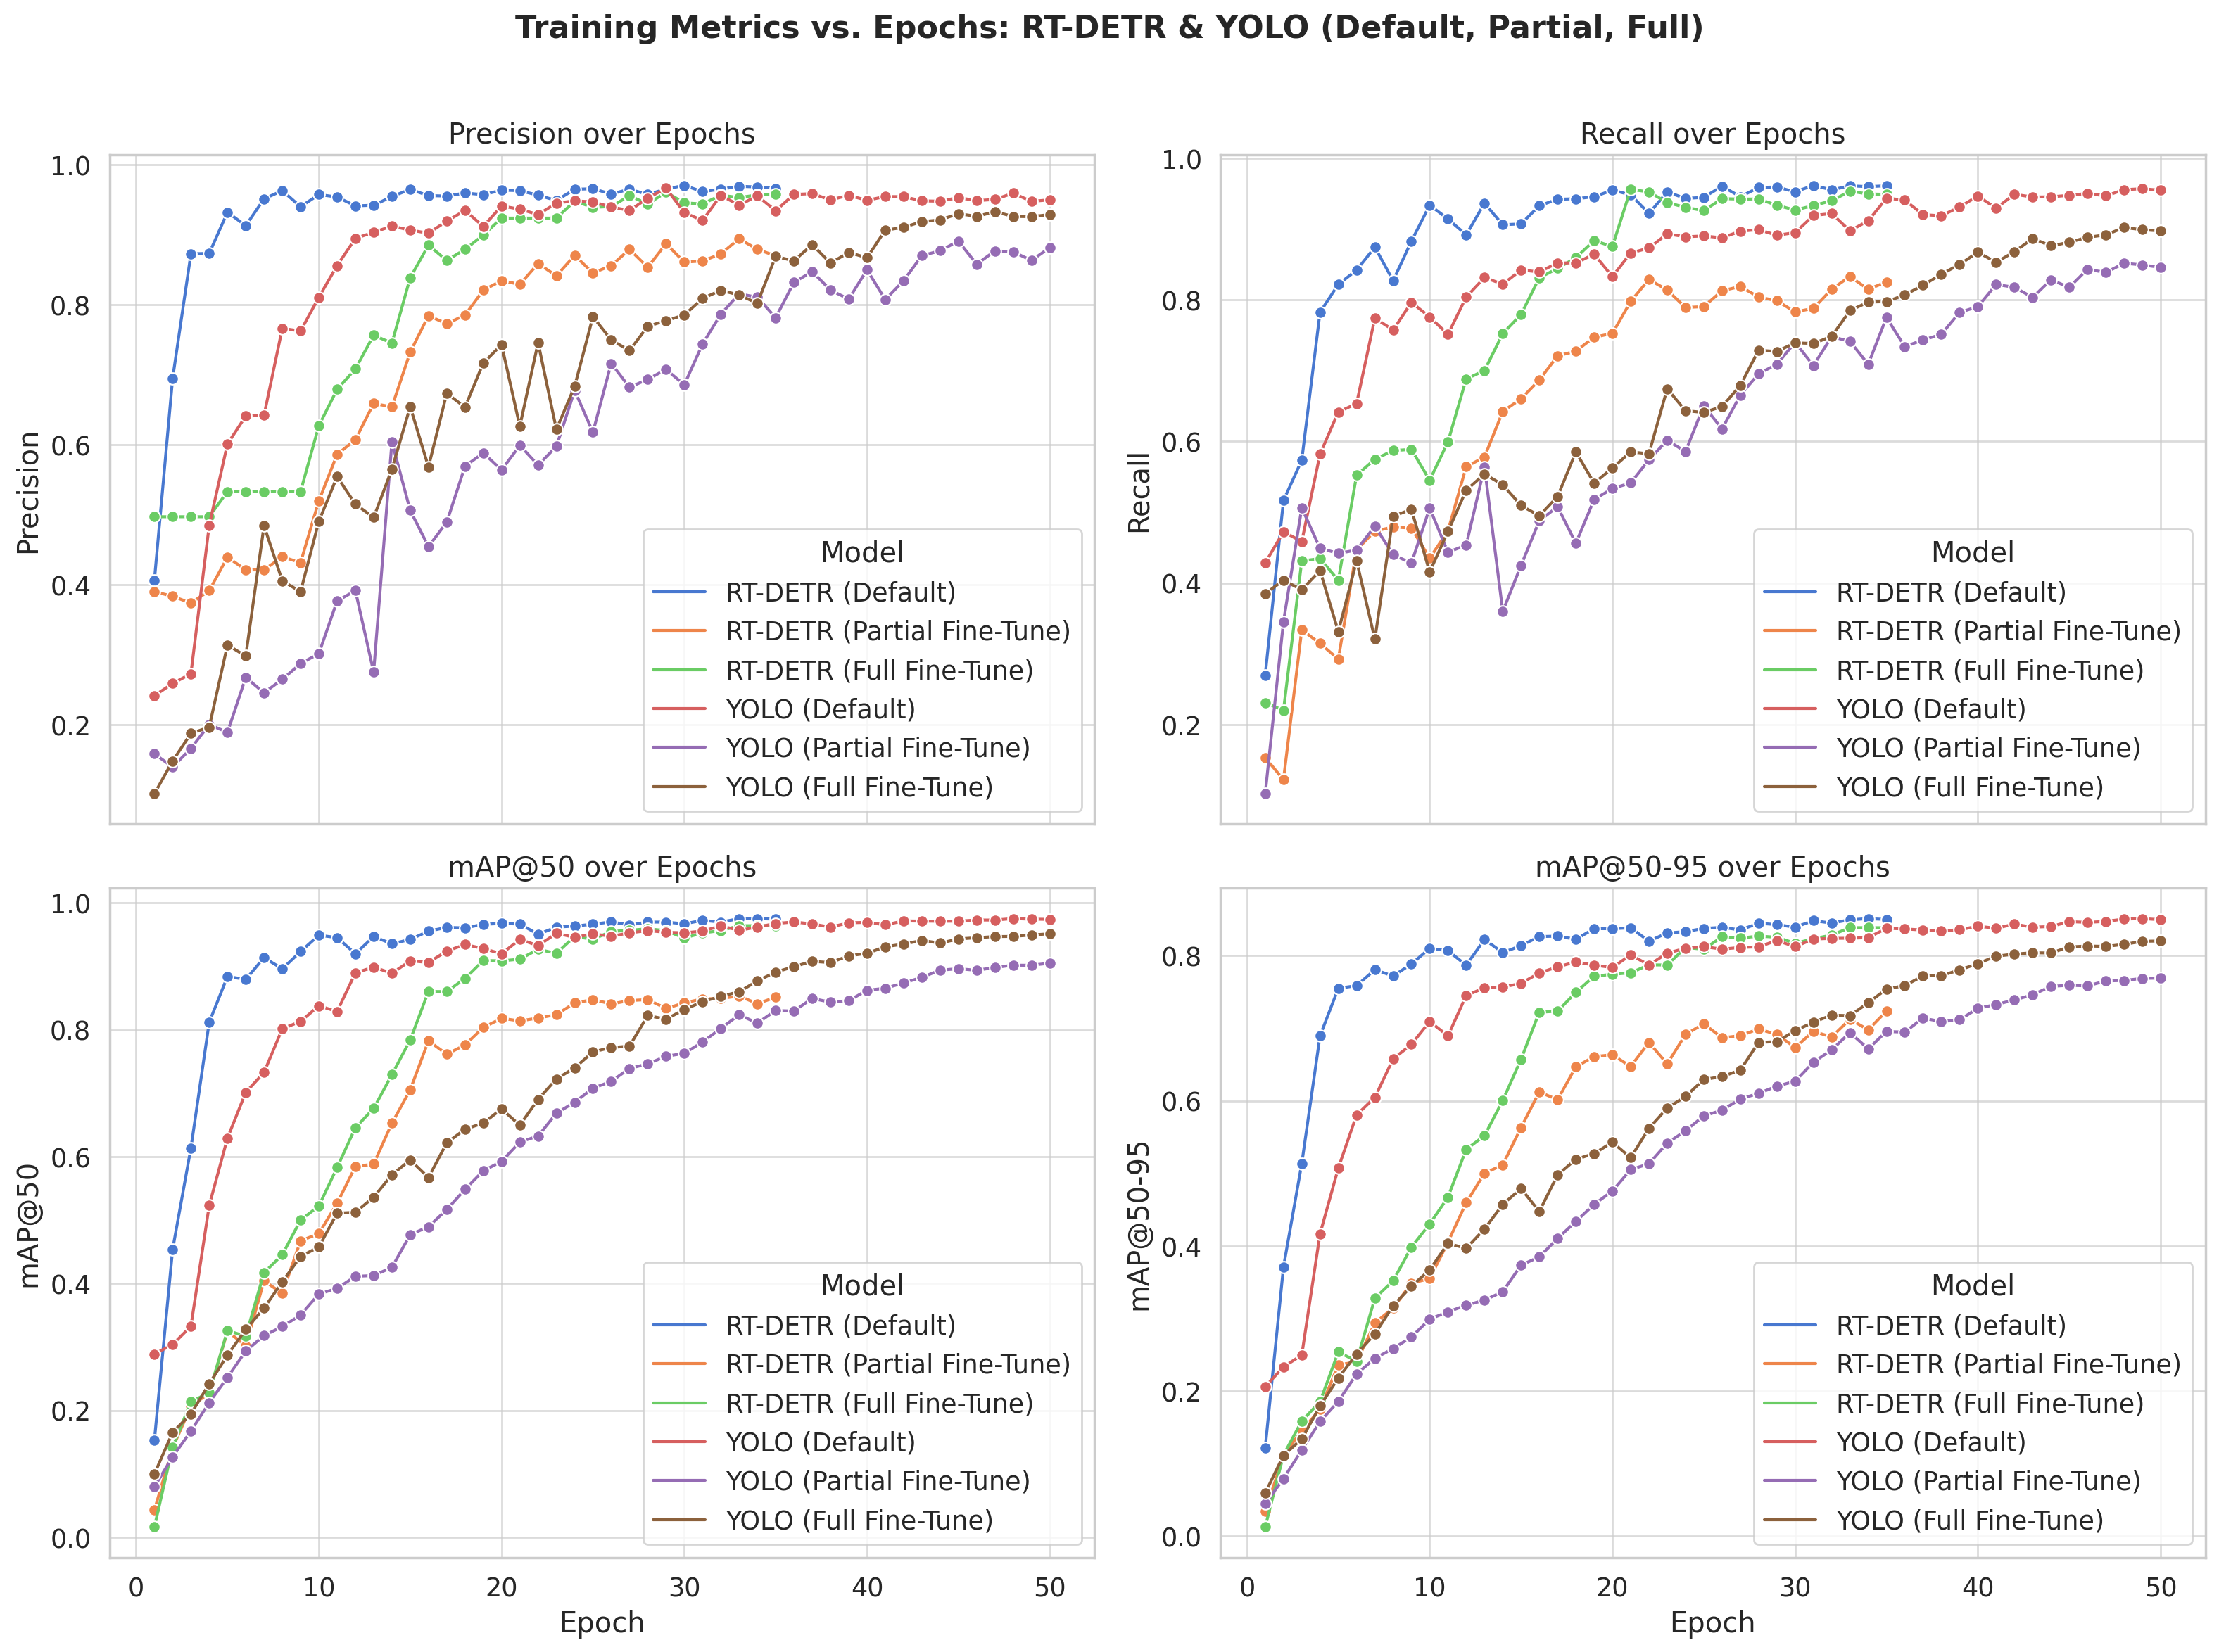 Figure 3 : Training metrics (precision, recall, mAP@50, and mAP@50-95) over epochs for all fine-tuning strategies.
Training Metrics Over Time
Figure 4 displays the same metrics over training time in seconds, offering insights into the efficiency of each approach. RT-DETR Default continues to dominate, achieving high scores rapidly and outperforming all other configurations with minimal training time. RT-DETR Full Fine-Tune starts more slowly but climbs steadily and eventually reaches near-optimal performance. However, RT-DETR Partial Fine-Tune, despite an early surge, levels off and falls behind both full and default configurations as training continues. In the YOLO models, Default fine-tuning shows the best long-term gains, gradually overtaking the other variants as time progresses. Meanwhile, YOLO Full and YOLO Partial Fine-Tune perform comparably, with YOLO Full slightly outperforming Partial Fine-Tune in the end for all metrics, possibly because of longer training time (for the same number of epochs).
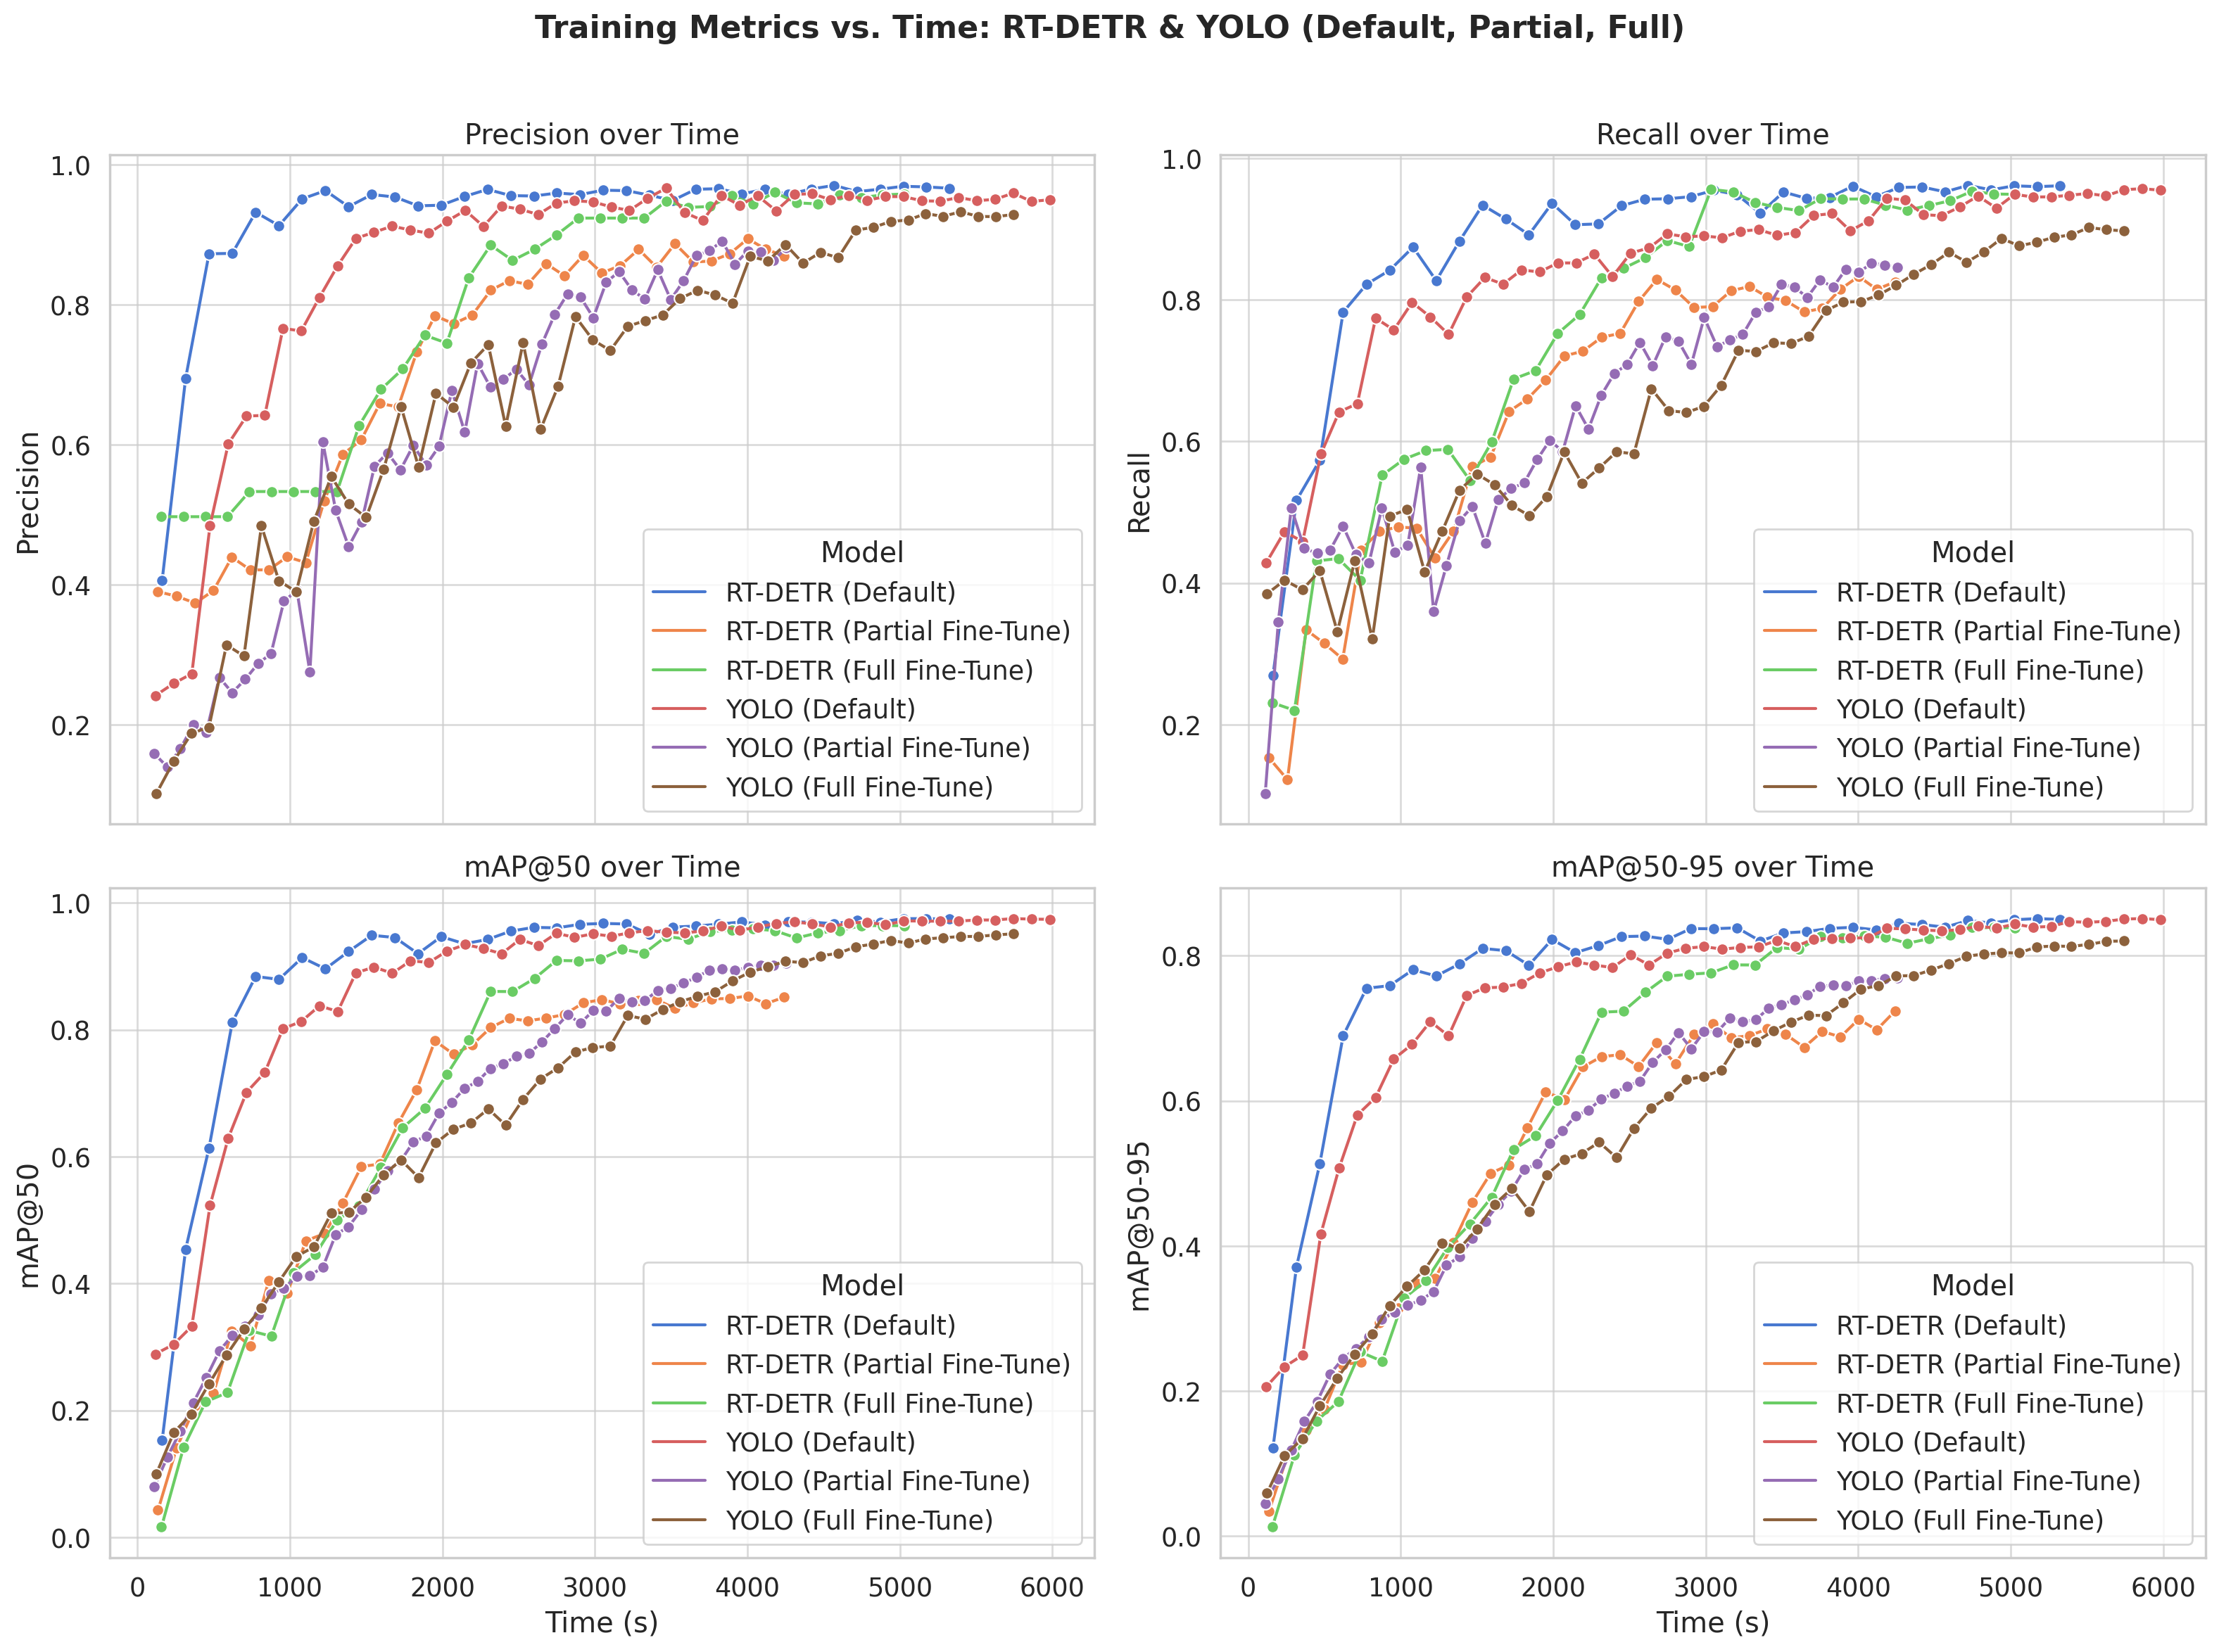 Figure 4 : Training metrics plotted over time (in seconds) to evaluate training efficiency.
Overall, RT-DETR outperforms YOLOv8, likely due to its advanced attention mechanism. Transferring from pedestrian-trained models is less effective than using default COCO weights, and freezing the backbone limits performance rather than speeds up learning.
Explainability with LIME and EigenCAM
Below are the visualizations generated by LIME and EigenCAM for both YOLOv8 and RT-DETR models.
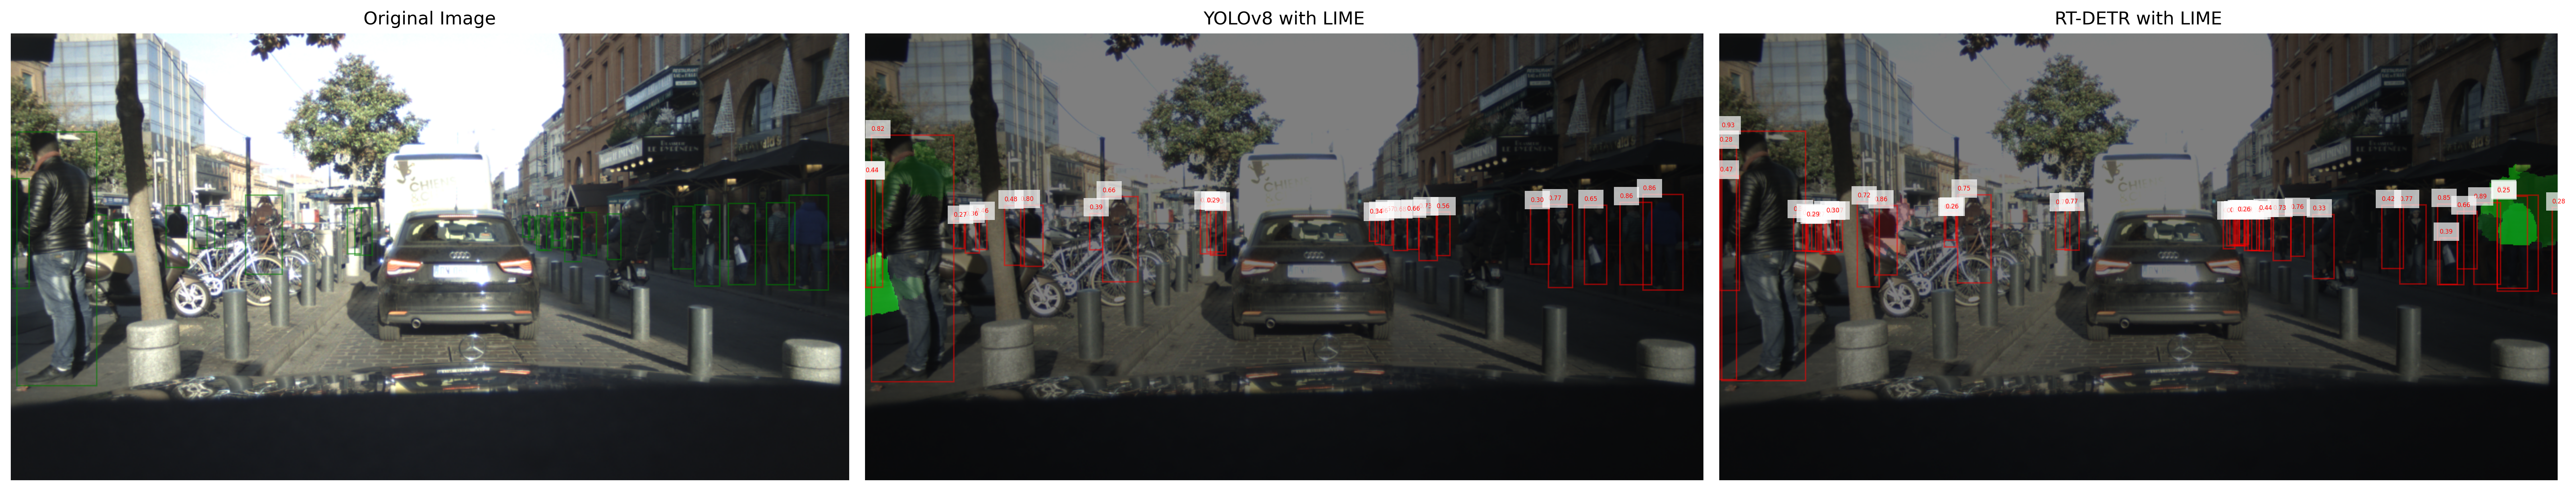 Figure 5 : LIME visualization with a lot of people of different scales. Green boxes denote ground truth bounding boxes, red boxes denote predicted bounding boxes with corresponding confidence scores.
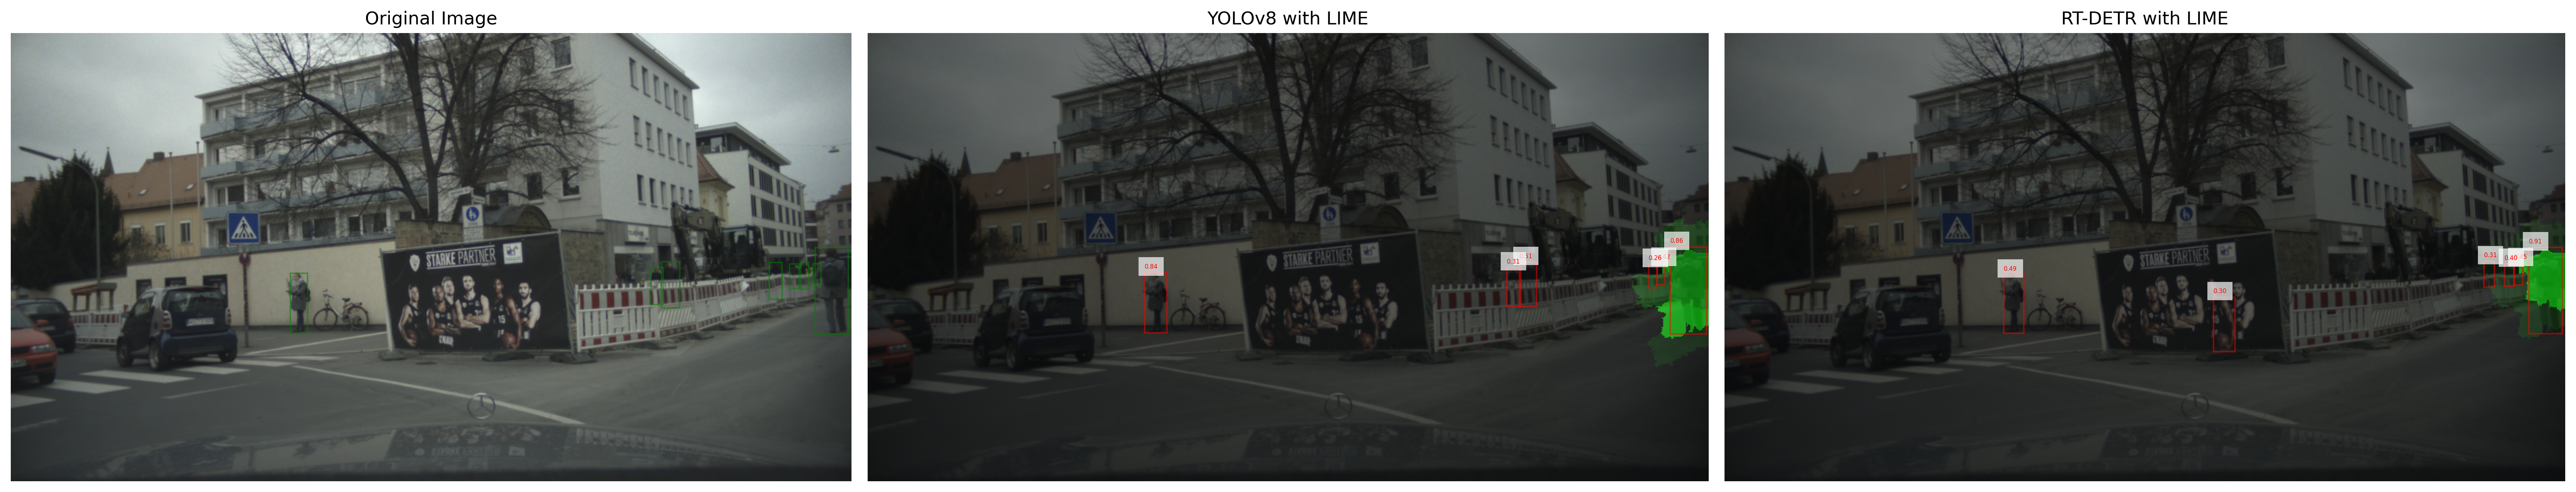 Figure 6 : LIME visualization with heavy occlusion. Green boxes denote ground truth bounding boxes, red boxes denote predicted bounding boxes with corresponding confidence scores.
While the LIME visualizations allow us to better understand the main model’s points of interest, the influential superpixels provide too scarce data for a detailed analysis. The LIME shows that both models focus most of the attention on certain pedestrians but do not allow us to detect the visual queries the model relies on. YOLOv8 and RT-DETR show similar patterns.
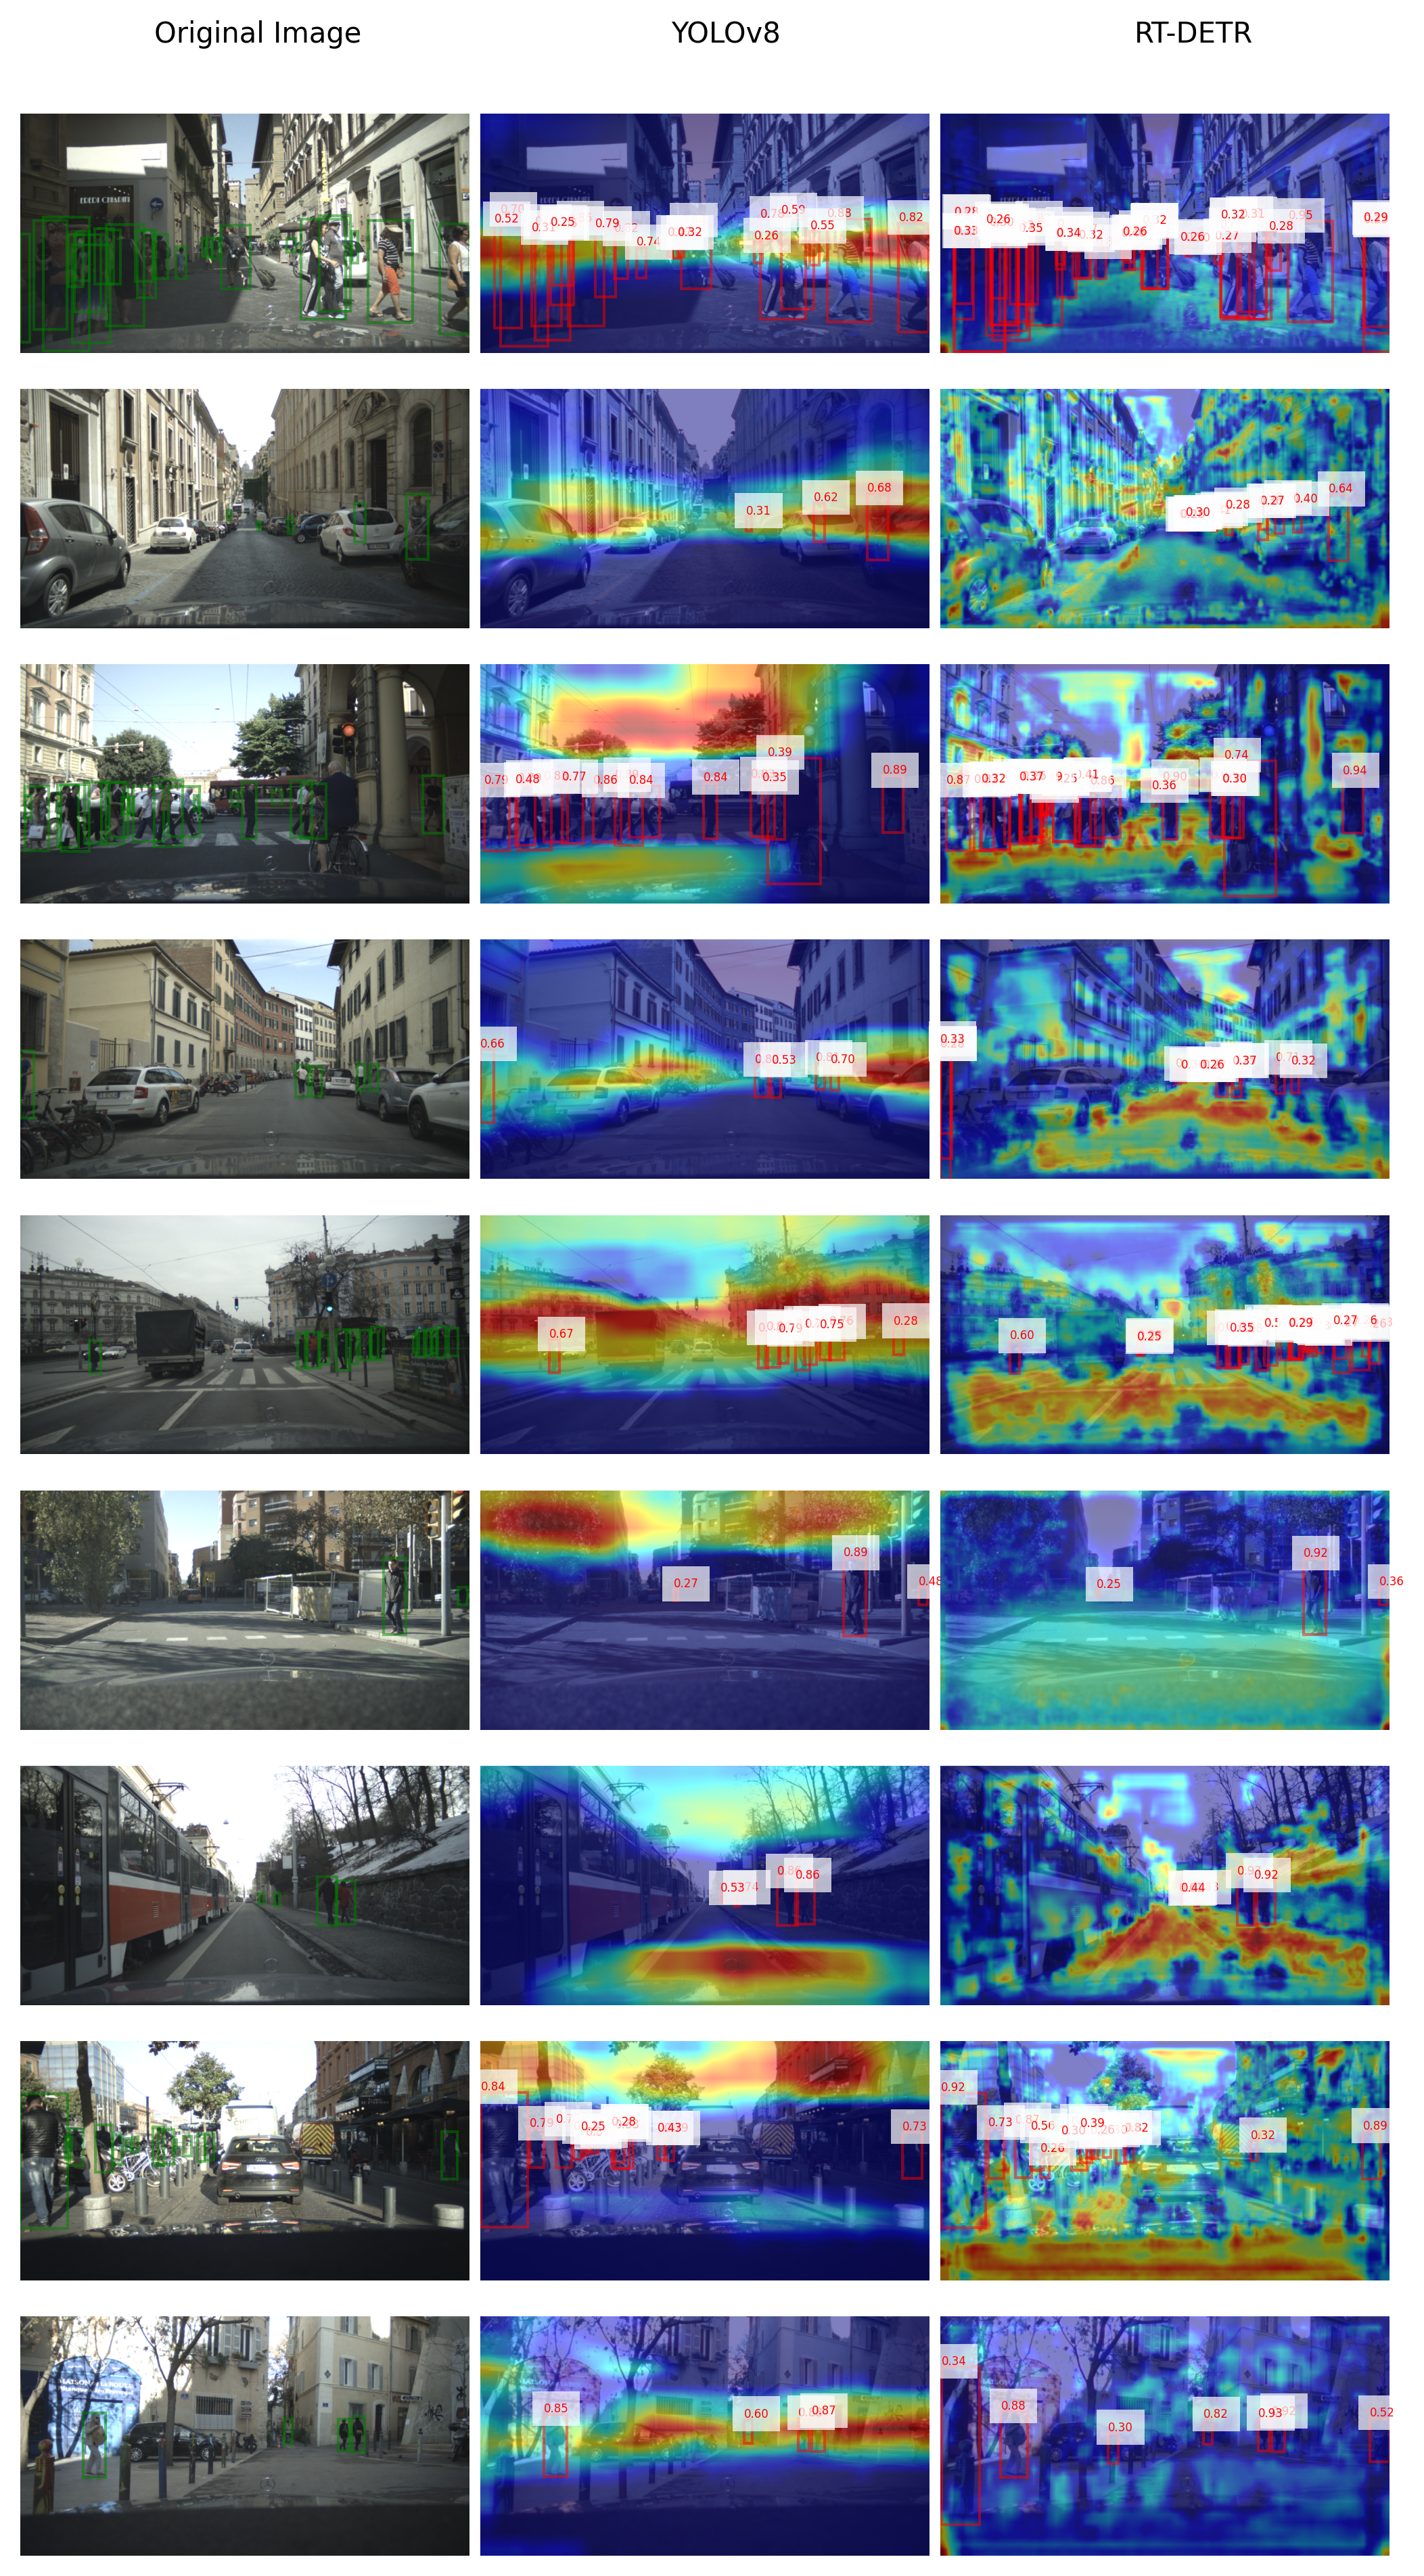 Figure 7 : EigenCAM visualization of images with varying pedestrian crowdedness, occlusion, and scale. Green boxes denote ground truth bounding boxes, red boxes denote predicted bounding boxes with corresponding confidence scores.
The EigenCAM visualization of selected images shows that the active areas vary greatly between YOLOv8 and RT-DETR. YOLOv8 has smoother and more uniform attention areas, while RT-DETR has more scattered and less uniform attention areas. Interestingly, the attention areas of both models are not always aligned with the detected pedestrians. The fact that the focus regions are not always aligned with the detected pedestrians suggests that the model does not rely solely on pedestrian-specific features.
Conclusion
This part summarizes our findings by briefly answering the research questions.
Augmentation Methods for testing robustness
Our experiments show that RT-DETR performs better in rain and well-lit conditions, while YOLOv8 is more robust in fog and night-time scenarios. This suggests that expected environmental conditions should guide the choice of model. Both models could benefit from further fine-tuning with augmented data to improve performance under adverse conditions.
Transfer Learning on Traffic Sign Detection Dataset
The results show that while transfer from pedestrian detection is possible, COCO-pretrained weights are more effective and efficient. This suggests that broad, diverse pretraining offers a stronger foundation than task similarity within the same traffic domain.
Explainability with LIME and EigenCAM
The LIME and EigenCAM visualizations demonstrate that both models focus on different aspects of the images, with YOLOv8 showing smoother attention areas and RT-DETR producing more scattered attention. This suggests that the shape of focus regions does not directly translate to an advantage in detection accuracy. Further research is needed to reveal the model’s internal decision process better.
References
- Alimov, M., & Meiramkhanov, T. (2024). Domain Generalization in Autonomous Driving: Evaluating YOLOv8s, RT-DETR, and YOLO-NAS with the ROAD-Almaty Dataset. arXiv preprint arXiv:2412.12349. https://arxiv.org/abs/2412.12349
- Carion, N., Massa, F., Synnaeve, G., Usunier, N., Kirillov, A., & Zagoruyko, S. (2020). End-to-End Object Detection with Transformers. arXiv preprint arXiv:2005.12872. https://arxiv.org/abs/2005.12872
- Lin, T.-Y., Maire, M., Belongie, S., Hays, J., Perona, P., Ramanan, D., Dollár, P., & Zitnick, C. L. (2014). Microsoft COCO: Common Objects in Context. In European Conference on Computer Vision (pp. 740–755). Springer. https://arxiv.org/abs/1405.0312
- Jocher, G., et al. (2023). YOLO by Ultralytics. https://github.com/ultralytics/ultralytics
- Ribeiro, M. T., Singh, S., & Guestrin, C. (2016). “Why should I trust you?”: Explaining the predictions of any classifier. In Proceedings of the 22nd ACM SIGKDD International Conference on Knowledge Discovery and Data Mining (pp. 1135–1144). https://doi.org/10.1145/2939672.2939778
- Luo, X., Shao, B., Cai, Z., & Wang, Y. (2024). A lightweight YOLOv5-FFM model for occlusion pedestrian detection. arXiv preprint arXiv:2408.06633. https://arxiv.org/abs/2408.06633
- Muhammad, M. B., & Yeasin, M. (2020, July). Eigen-CAM: Class activation map using principal components. In 2020 International Joint Conference on Neural Networks (IJCNN) (pp. 1–7). IEEE. https://doi.org/10.1109/IJCNN48605.2020.9206626
- Peng, H., & Chen, S. (2024). FedsNet: The real-time network for pedestrian detection based on RT-DETR. Journal of Real-Time Image Processing, 21, 142. https://doi.org/10.1007/s11554-024-01523-8
- Redmon, J., Divvala, S., Girshick, R., & Farhadi, A. (2016). You Only Look Once: Unified, Real-Time Object Detection. arXiv preprint arXiv:1506.02640. https://arxiv.org/abs/1506.02640
- Sadik, M. N., Hossain, T., & Sayeed, F. (2024). Real-Time Detection and Analysis of Vehicles and Pedestrians using Deep Learning. arXiv preprint arXiv:2404.08081. [https://- Zhang, X., Liu, X., Zhang, Y., Wang, Y., Lu, C., & Qiao, Y. (2023). RT-DETR: Real-Time Detection Transformer. arXiv preprint arXiv:2304.08069. https://arxiv.org/abs/2304.08069